Abstract
Bambara groundnut (Vigna subterranea) is a type of leguminous plant that thrives well in poor soil conditions and drought-prone areas and regions, making it an important crop for most subsistence farming practices and thus its capability to enhance food security in Africa. Studies have indicated and highlighted its resilience and ability to grow and be very productive even in harsh climates with minimal inputs and resources, which positions it as an important and sustainable crop for addressing food insecurity. However, despite its environmental resilience and nutritional potentials, this pulse still remains underutilized on the global market. This is particularly surprising given its rich nutrient profile, which makes it a valuable food source for health conscious consumers. Bambara Groundnut (Vigna subterranea (L.) verdc.) formulated diets were used in this nutrition work, with thirty (30) weaning wistar rats, comprising (six groups), including the test groups, the positive and the negative controls, in an in-vivo feeding experiment for 21 days, to determine the changes in growth, protein and important biochemical parameters. The results obtained showed that the dietary Feed Efficiency Ratio (FER) changes for the test groups ranges from 0.083 ± 0.03 for group 5 to 0.104 ± 0.03 for group 4; while the Net Protein Utilisation (NPU) ranges from 65.46 ±3.55 for group 5 to 81.70 ±2.78 for group 4. The Haematological parameters showed a hematocrit (PCV) for the test groups ranging from 34.95 ± 1.59% for group 6 to 42.63 ± 1.54% for group 5; while the RBC ranges from 6.65 ± 0.49 x 10⁹ / L for group 6 to 8.36 ± 0. 34 x 109 / L for group 4. Liver Enzyme activity were highest (AST) for group 3 with 171.30 ± 1.40 U/L, (ALP) for group 4 with 26.66 ± 0.41 U/L and (ALT) for group 5 with 128.33 ± 3.15 U/L. The work reveals the potentials of Bambara groundnut to sustain growth and developments, enhances cognitive developments, especially in children and adolescents.
|
Published in
|
European Journal of Preventive Medicine (Volume 14, Issue 1)
|
|
DOI
|
10.11648/j.ejpm.20261401.11
|
|
Page(s)
|
1-7 |
|
Creative Commons
|

This is an Open Access article, distributed under the terms of the Creative Commons Attribution 4.0 International License (http://creativecommons.org/licenses/by/4.0/), which permits unrestricted use, distribution and reproduction in any medium or format, provided the original work is properly cited.
|
|
Copyright
|
Copyright © The Author(s), 2026. Published by Science Publishing Group
|
Keywords
Vigna subterranea, Growth, Protein, Haematological Parameters, Nutrients
1. Introduction
The Bambara groundnut (
Vigna subterranea (L.) Verdc.) is an important legume which has been reported to be a balanced nutritional diet for the rural population of many developing countries, predominantly in Africa
| [10] | Hillocks, R. J., Bennett, C., and Mponda, O. M. Bambara nut: A review of utilization, market potential and crop improvement. African Crop Science Journal, vol. 20, no 1 pp 1-16 (2012). |
| [11] | Padulosi, S, N., Bergamini and Lawrence, T. (June 2011). On-farm conservation of neglected and underutilized species: status, trends and novel approaches to cope with climate change, Bioversity publication, (proceedings of the international conference Frankfurt, Germany. |
[10, 11]
Bambara groundnut (
Vigna subterranea (L.)
Verdc.)
could also be considered as a pulse with subterranean fruit–set and which is often cultivated by smallholders over much of semi-arid Africa
| [10] | Hillocks, R. J., Bennett, C., and Mponda, O. M. Bambara nut: A review of utilization, market potential and crop improvement. African Crop Science Journal, vol. 20, no 1 pp 1-16 (2012). |
| [12] | Rachie, K. O. & Silvester, P. (1977). Grain Legumes. In: Food crop of the lowland Tropics, Leakey, C. L A, and T. B. Wiliany (eds), Oxford University Press, U.K. pp. (41-74). |
| [13] | Sayed, Azam – Ali (2001). A Global Mapping System for Bambara Groundnut Production. FAO Agricultural Information Management Series, Rome. |
[10, 12, 13]
. It has been found to have an African origin
| [7] | Borget, M. (1992). Food Legumes. In: The Tropical Agriculturalist, CTA Macmillan. |
[7]
and it is widespread in the south of the Sahara
| [7] | Borget, M. (1992). Food Legumes. In: The Tropical Agriculturalist, CTA Macmillan. |
[7]
. Generally, food legumes have a major role to play in combating malnutrition due to their nutritional potentials. They serve as a source of protein for a large proportion of the population in the poor countries of the world by being the least expensive and easily stored and transported non-processed protein source for rural and urban dwellers
| [11] | Padulosi, S, N., Bergamini and Lawrence, T. (June 2011). On-farm conservation of neglected and underutilized species: status, trends and novel approaches to cope with climate change, Bioversity publication, (proceedings of the international conference Frankfurt, Germany. |
| [12] | Rachie, K. O. & Silvester, P. (1977). Grain Legumes. In: Food crop of the lowland Tropics, Leakey, C. L A, and T. B. Wiliany (eds), Oxford University Press, U.K. pp. (41-74). |
[11, 12]
. Throughout the developing world, micronutrient deficiency and malnutrition are on the increase and contribute to recent challenges and the most important factors influencing human health
| [14] | Micronutrients in African Bambara Groundnut (Vigna Subterranea L. verdc.) – A review. Atoyebi, John Olayinka. Presentation (poster code 120) at the 6th Global Microntrient Forum Conference, 16th – 20th October, 2023, at Hague, Netherlands. |
[14]
, resulting sometimes into degenerating conditions which can lead to loss of life, especially in children. However, resolving these constraints might be better addressed by preventive measures than curable ones. Hence nutritional approaches can be an important avenue to achieve these preventive measures. Bambara groundnut, with immense nutrition potentials
| [5] | Azam – Ali, S. N., Sesay, A., Karikari, S. K., Massawe, F. J. (2001). Assessing the potential of an under-utilised crop – a case study using Bambara groundnut. Experimental agriculture 37: 433-472 (2001). |
[5]
is to be investigated along this line.
2. Materials and Methods
2.1. Bambara Groundnut Accessions
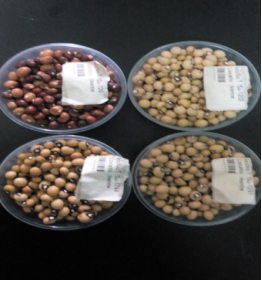
Bambara groundnut (Vigna sibterranea) accessions (4) of African origin, two with high protein and two with low protein were selected and regenerated from the global repository, domiciled at the Genetic Resources Centre (GRC) of the International Institute of Tropical Agriculture, IITA, Ibadan; and used as the test groups.
2.2. Preparation of Formulated Bambara Groundnut Diets
Yellow maize (Zea mays L) grains were purchased from the Bodija market, Ibadan, Oyo state, Nigeria. The maize grains was steeped into ordinary water for 72hours, they were later air-dried for 48hours. This was winnowed, milled and sieved to a fine powder using 0.5mm sieve. For the Bambara groundnut flour, the seeds were first picked of stones before soaking at room temperature for one hour. They were then boiled at a temperature of about 100º C for 45 min, followed by air-drying for 48 hours, then sieved using 0.5mm sieve to a fine powder after milling. After the other necessary ingredients were added, the formulated diets were then pelletised using a manual mechanical pelletiser using 0.05% starch as a binder before air drying for 3-4 days before the pellets are then packed for the animal house experiment. The procedure of the report of the Food and Agricultural Organization and World Health Organisation Expert Consultation (1991) on animal feeding protocol was used for this study.
2.3. Animal Experiment
The method prescribed in the Report of the Food and Agricultural Organization and World Health Organisation Expert Consultation (1991) on animal feeding protocol was used for this study
| [9] | FAO (1991). Report of an FAO Expert Consultation; Food and Agriculture Organization of the United Nations: Rome, Italy. |
[9]
. Male weaning albino rats of 75-80g were housed in individual cages in care room of the Babcock University animal facility at 18-26° C (modified to 22-30oC) and 40-70% relative humidity. Standardized laboratory rat chow were fed to the rats for an acclimation period of 2 days, thereafter the rats were re-distributed into 6 groups of 5 rats each such that the mean weights of each block is within 5g. Water was provided
ad libitum, but diets restricted to 15g dry matter/day. Protein free diet and the test diets were fed to the animals for a 4-day preliminary period, a 5-day balance period (sub-total of 9 days) and a growth evaluation period of additional 21 days; making a total of 30 days. On each of the 5 days of the balance period, faeces and spilled food for each rat were collected and carefully separated and composite in open containers (one for the faeces and one for the food). At the end of the 5-day balance period, the spilled foods were air dried for 3 days and its weight used in correcting for total food intake. Faeces were dried overnight (12 hours) in a dry-air oven at 100° C, weighed, ground, and analysed for nitrogen. The faecal and the urine of each group were collected and pooled together for analysis.
| [1] | AOAC (2000). Official Methods of Analysis (edited by W. Herwitz), Arlington, VA; Association of Official Analytical Chemists. |
| [2] | AOAC (2005). Official Methods of Analysis. Association of Official Analytical Chemists (15th ed.) Washington, DC, USA., 19. |
[1, 2]
2.4. Animal Handling for Anthropometric Study
Anthropometric measurements of the animal were done at weekly interval. These includes body weight, body length, head circumference, hip circumference and arm length of each rat were taken to be used in evaluating the anthropometric performance of the food types under investigation in the subjects. Body weight of the animals were taken with use of Ohauz electronic balance (500g maximum weight capacity) while other measurements were done using glass fibre measuring tape.
2.5. Animal Sacrifice
After 21 days of the feeding experiment, the animals were anaesthetized with the use of diethyl ether. They were then sacrifice (open up) by cardiac puncture and blood taken from the heart into already labelled heparinized bottle. Selected organs (kidney, liver and pancreas were stored in 10% formalin prior to weighing.
2.6. Haematological Parameters
Cardiac puncture was performed on the animal, using ether as anesthesia, and blood samples were collected aseptically into the tri-potassium ethylene diamine tetra acetic acid (K3EDTA) bottles. The blood was mixed by gentle inversion and then analyzed for complete blood count using Mindray 3200 hematology auto analyzer by following the manufacturer’s instructions.
2.7. Liver Enzymes (AST, ALT and ALP) and Serum Proteins
Following the collection of the whole blood, via cardiac puncture with the animal’s sedated using ether as anesthesia, into heparin, the blood was spun at 3000 rmp for 5minutes to separate serum from the whole blood. The serum was harvested into plain bottle and then used to assay liver enzymes and proteins using Mindray auto analyzer. The manufacturer’s instructions were strictly followed to analyze the samples.
3. Results
Table 1. Mean proximate analysis of the Bambara formulated diets.
Groups | Carbohydrate (%) | Protein (%) | Crude fibre (%) | Ash (%) | Fat (%) | Moisture content (%) |
1 | 57.06 ±2.31c | 22.06 ±0.02e | 2.30 ±0.01c | 5.12 ±0.01f | 3.31 ±0.01d | 10.15 ±1.21a |
2 | 69.51 ±3.01a | 10.62 ±0.01f | 2.06 ±0.01e | 5.40 ±0.03e | 3.30 ±0.02d | 9.11 ±0.09b |
3 | 68.04 ±2.75b | 12.62 ±0.02d | 2.12 ±0.04d | 5.52 ±0.02d | 3.21 ±0.02e | 8.49 ±0.05c |
4 | 66.65 ±4.21d | 13.00 ±0.03c | 2.60 ±0.01b | 5.63 ±0.05c | 3.85 ±0.01c | 8.27 ±0.04d |
5 | 63.51 ±2.05e | 14.12 ±0.02b | 3.31 ±0.03a | 5.94 ±0.04b | 4.58 ±0.04a | 8.54 ±0.05c |
6 | 62.96 ±1.78f | 15.05 ±0.03a | 3.21 ±0.02a | 6.23 ±0.03a | 4.40 ±0.03b | 7.95 ±0.05e |
Legend: Data were analysed in triplicates; Data = Mean ± SEM, n=3. Values represents the mean of carbohydrate, protein, fat, crude fibre, ash and moisture content of the Bambara formulated diets. Group 1 is the positive control with casein as the protein source. Group 2 is the negative controls. Group 3, 4, 5, 6 are the test diets with Bambara TVSu 1231, 729, 1202 and 1744 inclusion. Values with different superscripts along a column are significantly different (p ˂ 0.05).
Figure 1. Showing the 4 test diets of Bambara groundnut.
Table 2. Mean Growth and Protein efficiency ratio.
Groups | Feed Conversion Ratio (FCR) | Feed Efficiency Ratio (FER) | Protein Efficiency Ratio (PER) | Nitrogen Efficiency Ratio (NER) |
1 | 3.53 ± 0.14f | 0.280 ± 0.04d | 1.670 ± 0.01a | 0.085 ± 0.04d |
2 | 18.91 ± 0.76e | 0.052 ± 0.01e | 0.166 ± 0.20e | 0.004 ± 0.05a |
3 | 3.29 ± 0.28d | 0.303 ± 0.01a | 0.803 ± 0.03b | 0.072 ± 0.01c |
4 | 3.18 ± 0.95c | 0.314 ± 0.03a | 0.804 ± 0.05b | 0.070 ± 0.02c |
5 | 3.81 ± 0.20b | 0.262 ± 0.03c | 0.591 ± 0.03d | 0.059 ± 0.03b |
6 | 3.62 ± 0.75a | 0.276 ± 0.04b | 0.604 ± 0.04c | 0.060 ± 0.01b |
Legend: Data were analysed in triplicates; Data = Mean ± SEM, n=3. showing growth and protein efficiency ratio, nitrogen efficiency ratio and mineral efficiency ratio. Values with different superscripts along a column are significantly different (p ˂ 0.05).
Table 3. Mean in-vivo Protein Quality parameters.
Groups | Net Protein Ratio (NPR) | Net Protein Utilisation (NPU) | Biological Value (BV) % | Apparent Protein Digestibility (APD) % | True Protein Digestibility (TPD) % |
1 | 1.547 ±1.21a | 81.72 ± 3.51c | 88.30 ± 3.21c | 87.25 ±2.42e | 92.55 ±3.06c |
2 | 0.166 ± 0.05d | 49.36 ± 3.55a | 80.21 ± 4.01b | 57.05 ±3.15c | 61.55 ±2.02a |
3 | 0.681 ± 0.03b | 73.55 ± 3.82d | 86.48 ± 4.40a | 70.79 ±2.01f | 85.05 ±2.75d |
4 | 0.689 ± 0.02b | 55.70 ±2.78b | 88.98 ± 2.70d | 56.73 ±2.64d | 62.60 ±3.55b |
5 | 0.470 ± 0.03c | 82.26 ±3.55f | 95.18 ± 4.52c | 80.97 ±3.51b | 86.52 ±2.52f |
6 | 0.489 ± 0.05c | 80.27 ±4.05e | 87.01 ± 5.22a | 88.93 ±2.78a | 92.20 ±3.03e |
Legend: Data were analysed in triplicates; Data = Mean ± SEM, n=3. Values with different superscripts along a column are significantly different (p ˂ 0.05). Values with different superscripts along a column are significantly different (p ˂ 0.05).
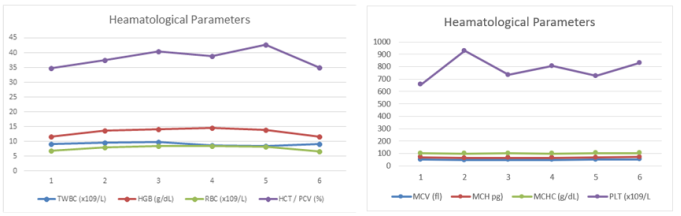
Figure 2. Haematological Parameters.
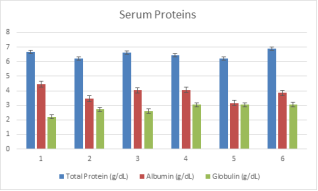
Figure 3. Fractionation of the serum proteins.
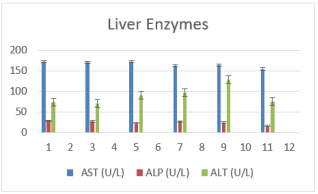
Figure 4. Serum Liver Enzymess.
4. Discussion
The growth parameters for the groups showed the positive control having almost the highest amount of 25.40±2.15g weight changes over the 21 days feeding period with a total mean diet of 270.40±2.22g consumed per rat within this period. Groups 3 and 4 were the comparable to these values. Group 3 gave weight changes of 27.80±4.92g, while group 4 had a value of 29.30±2.45g, with a mean diet of 274.80±3.20g and 280.20±0.60g respectively over the 21days feeding period. However, apart from the group 2 (negative control), the groups with the least of the differential weight changes over the feeding period are groups 5 and 6. While group 5 had a weight change of 20.60±2.24g for a total diet of 247.20±1.31g consumed over the 21days period, group 6 had a weight change of 22.05±1.22g for a total diet of 240.13±4.01g consumed within the same period of 21days. It was however observed that despite the approximately same amount of diet consumed by groups 2 and 6, this does not translate into appropriate differential weight in the two groups; as group 6 has a weight change of 22.05±1.22g, which is by far different from the weight change of group 2 which is 4.20±0.91g. This is understandable, since group 2 is the negative control and essentially has least amount of protein. This lack in protein which is supposes to assist to promote growth and by implication, the weight change of an individual is however reduced here, as most of the diet consumed does not translate to appropriate weight changes in the animals in this group.
The anthropometric readings were taken as one of the direct approach to measure growth in Nutrition biochemistry. The results obtained showed that the mean body length for groups 3 and 4 are comparable to that of the positive control diet. It showed a mean value of 34.88 ±0.74cm for group 3 from the initial body length of 29.94 ±0.79cm; while group 4 gave a mean body length of 34.72 ±0.42cm from an initial mean value of 29.90 ±0.55cm. Both of these values are closer to the amount obtained for the positive control diet, with a final mean body length of 35.22 ±0.63cm from an initial mean value of 29.04 ±0.59cm, as compared to the negative control group, which has a final mean length of 33.00 ±0.88cm, from an initial mean length of 28.60 ±1.12cm. The least of the body length increases were observed for groups 5 and 6. Group 5 had a final mean body length of 33.60 ±1.01cm, from an initial value of 29.00 ±0.98cm; while group 6 ended with a mean body length of 32.82 ±0.45cm from an initial mean of 28.84 ±0.80cm. Both of these body length seems comparable with the ones obtained for the negative control diet group. The final value obtained for the final body length of the negative control diet is 33.00 ±0.88cm from an initial mean value of 28.60 ±1.12cm.
The Feed Conversion Ratio (FCR) was the least for group 1, which is the positive control, followed by groups 2, 3, 4, 5 and 6 in that order of increase. However, the Feed Efficiency Ratio (FER), which stipulates the ratio of body weight gain to the amount of feed dietary intakes. The FER was the highest for group 1 with 0.201 ± 0.04, meaning that this group is the best in the conversion of the feed intake to appropriate weight gain. This was followed by group 4 with 0.104 ± 0.03 and closely with group 3 with 0.101 ± 0.01. Group 6 has a FER of 0.091 ± 0.04, while Group 5 has a FER of 0.083 ± 0.03. The group with the least FER is group 2 with 0.017 ± 0.01. As for the Protein Efficiency Ratio (PER), group 1 best converted the amount of the protein in the diet to meaningful weight changes with a ratio of 1.670 ± 0.01. This was followed by groups 3 and 4 with comparable values. While group 4 has a ratio of 0.804 ± 0.05, group 3 has a PER of 0.803 ± 0.03. Moreso this was followed by the PER of groups 6, which is 0.604 ± 0.04, while group 5 has a PER value of 0.591 ± 0.03. As for the Nitrogen Efficiency Ratio (NER), group 2, with a ratio of 0.404 ± 0.05. This was followed by close values obtained for groups 5 and 6. While group 6 has a NER of 0.110 ± 0.01, the NER for group 5 was 0.109 ± 0.03. The NER for groups 3, 4 and 1 in that order are 0.072 ± 0.01, 0.070 ± 0.02 and 0.035 ± 0.04 respectively.
The results of the haematological parameters revealed that the total white blood cells count (TWBC) was highest for group 3 with 9.75 ± 1.59 x 10⁹ / L, followed by group 2 with 9.43 ± 2.34 x 10⁹ / L, then group 6 with 9.20 ± 1.06 x 10⁹ / L. The least amount of the TWBC are for groups 4 and 5 with values of 8.66 ± 2.00 x 10⁹ / L and 8.50 ± 1.04 x 10⁹ / L respectively. As for the haemoglobin concentration (HGB), the highest value was obtained for group 4 with 14.43 ± 0.79 g / dL, followed by group 3 with 14.00 ± 0.08 g / dL. The least of the haemoglobin concentration values were obtained for groups 1 and 6, with HGB values of 11.56 ± 0.76 g / dL and 11.70 ± 0.63 g / dL respectively. The Red Blood cells count (RBC) were the highest for groups 3 and 4 with values of 8.30 ± 0.17 x 10⁹ / L and 8.36 ± 0. 34 x 109 / L respectively, while the least values obtained were for groups 1 and 6 with the RBC values of 6.76 ± 0.43 x 10⁹ / L and 6.65 ± 0.49 x 10⁹ / L respectively. As for the Haematocrit (HCT) or the Pack Cell volume (PCV) values, the highest obtained were for groups 3 and 5 with 40.55 ± 0.46% and 42.63 ± 1.54% respectively, while the least values are for groups 1 and 6, with PCV values of 34.83 ± 2.41% and 34.95 ± 1.59% respectively. The Mean Corpuscular volume (MCV) was highest for groups 1 and 6 with values of 51.63 ± 0.56 fl and 53.20 ± 2.14 fl respectively, while the MCV were the least for groups 2 and 4 with values of 47.06 ± 0.58 fl and 48.70 ± 0.32 fl respectively. The Mean Corpuscular haemoglobin (MCH) were the highest for groups 5 and 6 with values of 17.50 ±0.37 pg and 17.65 ±0.35 pg respectively, while the least value was for group 4 with a MCH of 16.73 ± 0.24 pg. The Mean Corpuscular haemoglobin concentration (MCHC) were highest for groups 2 and 5 with values of 36.06 ± 0.21 g / dL and 35.00 ± 0.30 g / dL respectively, while the least value was for group 1 with a MCHC value of 33.20 ±0.40g / dL. Finally, the Platelet count (PLT) were the highest for groups 2 and 6 with values of 826.66 ±e 92.81 x 10⁹ / L and 727.00 ±51.38 x 10⁹ / L respectively, while the least PLT was obtained for group 1 with 553.00 ± 13.49 x 10⁹ / L.
The Biochemical analysis of the serum proteins revealed a highest mean amount of total protein of 6.90 ± 0.02(g/dL) and 6.66 ± 0.04 (g/dL) for groups 6 and 1respectively, while groups 2 and 5 had the least mean amount of total serum protein with values 6.20 ± 0.10(g/dL) and 6.20 ± 0.08(g/dL) respectively. The fractionation of the serum proteins revealed that the amount of the Albumin content was the highest in groups 1, 3 and 4 with the values of 4.46 ± 0.17 (g/dL), 4.03 ± 0.21(g/dL) and 4.06 ± 0.30 (g/dL) respectively, while the least mean values were obtained for groups 5 and 2 with values of 3.16 ± 0.57 (g/dL) and 3.46 ± 0.25 (g/dL) respectively. As for the Globulin, the highest values were obtained for groups 4, 5 and 6 with the protein amount of 3.03 ± 0.19(g/dL), 3.03 ± 0.15(g/dL) and 3.05 ± 0.27(g/dL) respectively, while group 1 had the least amount with 2.20 ± 0.16 (g/dL).
The results of the liver enzymes Aspartate transaminase (AST), Alkaline phosphatase (ALP) and Alanine transaminase (ALT) revealed a higher AST activity for group 3 comparable to the positive control. The group has a AST activity of 171.30 ± 1.40 (U/L), as could be compared to the positive control with a AST activity of 172.a00 ± 5.88 (U/L). The least AST activity was observed for group 6 with 154.00 ± 2.17 (U/L). As for the ALP, groups 2 and 4 had activity values closer to the positive control. Their ALP amount are 27.00 ± 0.72 (U/L) and 26.66 ± 0.41(U/L) respectively, as compared to the positive control with a ALP value of 28.00 ± 1.24 (U/L). The least ALP amount was observed for group 6 with a value of 16.00 ± 2.50 (U/L). Finally, the ALT activity results showed the highest amount obtained for group 5 to be 128.33 ± 3.15(U/L). This was followed by groups 4 and 3, with the ALT activity of 97.33 ± 5.20(U/L) and 90.33 ± 3.77(U/L) respectively. Next are groups 6 and 1 which has closer ALT activity. Their values are 75.50 ± 2.31(U/L) and 73.33 ± 3.13(U/L) respectively. The least ALT activity was observed for group 2 with a value of 70.66 ± 1.22(U/L).
5. Conclusions
It could be inferred and concluded from the results obtained that groups 3 and 4 showed the best evidence for Protein bioavailability and Utilisation
| [4] | Atoyebi, O. J., & Esan, E. B. (September, 15th-20th, 2013). Bambara groundnut (vigna subterranea) as a panacea for malnutrition in developing countries like Nigeria. Poster presentation at the IUNS 20th International Congress of Nutrition, Granada, Spain. |
[4]
for growth and developments. Some of the important parameters adjudged these findings are the FER, PER, NPU and also the TPD values obtained. The TPD parameter is very important, along with the Biological Value (BV) and the True Protein Digestibility (TPD), in the sense that it might be essential to view the Bambara groundnut inclusions utilised for the groups 3 and 4 as being of the best performance in terms of bioavailability and use by the body of a living organisms for better growth and developments, hence could be further recommended for complimentary feeding approaches and for infants, as a necessary supply of thee available proteins and essential amino acids for their growth and developments
| [3] | Atoyebi, O. J., Adebawo, O. O., Osilesi, O., & Esan, E. B. (August 26-30, 2013). Towards biofortification of Bambara groundnut (Vigna subterranea) in Nigeria to combat hidden hunger. Presentation at the BSN Conference, Abuja, Nigeria. |
| [8] | Catherine R., Benjamin C., & Robert J. C. (2013). Modern Nutrition in Health and Disease (11th ed.). |
| [15] | Odeniran O M (January 30, 2025) Exploring the Potential of Bambara Groundnut Flour as an Alternative for Diabetic and Obese Patients in the USA: A Comprehensive Review. Cureus 17(1): e78258. https://doi.org/10.7759/cureus.78258 |
[3, 8, 15]
.
The above results corroborated the weight changes values observed for these 2 groups, which are also the highest with values 27.80±4.92g and 29.30±2.45g respectively, as could be compared to those of groups 5 and 6, which are 20.60±2.24g and 22.05±1.22g respectively. Hence, sustainable use of under-utilised crops like Bambara has immense nutrition potentials
| [3] | Atoyebi, O. J., Adebawo, O. O., Osilesi, O., & Esan, E. B. (August 26-30, 2013). Towards biofortification of Bambara groundnut (Vigna subterranea) in Nigeria to combat hidden hunger. Presentation at the BSN Conference, Abuja, Nigeria. |
| [6] | Bamishaiye, O. M., Adegbola, J. A. & Bamishaiye, E. I. (2011). Bambara groundnut: an under-utilized nut in Africa. Advances in Agricultural Biotechnology 1: 60-72. |
| [11] | Padulosi, S, N., Bergamini and Lawrence, T. (June 2011). On-farm conservation of neglected and underutilized species: status, trends and novel approaches to cope with climate change, Bioversity publication, (proceedings of the international conference Frankfurt, Germany. |
[3, 6, 11]
.
Abbreviations
AST | Aspartate Transaminase |
ALP | Alkaline Phosphatase |
ALT | Alanine Transaminase |
Acknowledgments
I Acknowledge the part financial support provided by the IITA, Ibadan, Nigeria.
Author Contributions
Atoyebi John Olayinka Conceptualisation, Data curation
David Aderemi Ajayi: Resources, Writing – review & editing
Oluwasanmi Moses Odeniran: Resources, Writing – review & editing
Funding
This work was supported financially majorly by the main author and partly by the IITA, Ibadan, Nigeria.
Data Availability Statement
The data supporting the outcome of this research work has been reported in this manuscript.
Conflicts of Interest
The authors declare no conflicts of interest.
References
| [1] |
AOAC (2000). Official Methods of Analysis (edited by W. Herwitz), Arlington, VA; Association of Official Analytical Chemists.
|
| [2] |
AOAC (2005). Official Methods of Analysis. Association of Official Analytical Chemists (15th ed.) Washington, DC, USA., 19.
|
| [3] |
Atoyebi, O. J., Adebawo, O. O., Osilesi, O., & Esan, E. B. (August 26-30, 2013). Towards biofortification of Bambara groundnut (Vigna subterranea) in Nigeria to combat hidden hunger. Presentation at the BSN Conference, Abuja, Nigeria.
|
| [4] |
Atoyebi, O. J., & Esan, E. B. (September, 15th-20th, 2013). Bambara groundnut (vigna subterranea) as a panacea for malnutrition in developing countries like Nigeria. Poster presentation at the IUNS 20th International Congress of Nutrition, Granada, Spain.
|
| [5] |
Azam – Ali, S. N., Sesay, A., Karikari, S. K., Massawe, F. J. (2001). Assessing the potential of an under-utilised crop – a case study using Bambara groundnut. Experimental agriculture 37: 433-472 (2001).
|
| [6] |
Bamishaiye, O. M., Adegbola, J. A. & Bamishaiye, E. I. (2011). Bambara groundnut: an under-utilized nut in Africa. Advances in Agricultural Biotechnology 1: 60-72.
|
| [7] |
Borget, M. (1992). Food Legumes. In: The Tropical Agriculturalist, CTA Macmillan.
|
| [8] |
Catherine R., Benjamin C., & Robert J. C. (2013). Modern Nutrition in Health and Disease (11th ed.).
|
| [9] |
FAO (1991). Report of an FAO Expert Consultation; Food and Agriculture Organization of the United Nations: Rome, Italy.
|
| [10] |
Hillocks, R. J., Bennett, C., and Mponda, O. M. Bambara nut: A review of utilization, market potential and crop improvement. African Crop Science Journal, vol. 20, no 1 pp 1-16 (2012).
|
| [11] |
Padulosi, S, N., Bergamini and Lawrence, T. (June 2011). On-farm conservation of neglected and underutilized species: status, trends and novel approaches to cope with climate change, Bioversity publication, (proceedings of the international conference Frankfurt, Germany.
|
| [12] |
Rachie, K. O. & Silvester, P. (1977). Grain Legumes. In: Food crop of the lowland Tropics, Leakey, C. L A, and T. B. Wiliany (eds), Oxford University Press, U.K. pp. (41-74).
|
| [13] |
Sayed, Azam – Ali (2001). A Global Mapping System for Bambara Groundnut Production. FAO Agricultural Information Management Series, Rome.
|
| [14] |
Micronutrients in African Bambara Groundnut (Vigna Subterranea L. verdc.) – A review. Atoyebi, John Olayinka. Presentation (poster code 120) at the 6th Global Microntrient Forum Conference, 16th – 20th October, 2023, at Hague, Netherlands.
|
| [15] |
Odeniran O M (January 30, 2025) Exploring the Potential of Bambara Groundnut Flour as an Alternative for Diabetic and Obese Patients in the USA: A Comprehensive Review. Cureus 17(1): e78258.
https://doi.org/10.7759/cureus.78258
|
Cite This Article
-
APA Style
Olayinka, A. J., Ajayi, D. A., Odeniran, O. M. (2026). Protein Quality Assessments Using In-vivo Experimental Model on Bambara Groundnut
(Vigna subterranea (L.) verdc.) Formulated Diets. European Journal of Preventive Medicine, 14(1), 1-7. https://doi.org/10.11648/j.ejpm.20261401.11
 Copy
|
Copy
|
 Download
ACS Style
Olayinka, A. J.; Ajayi, D. A.; Odeniran, O. M. Protein Quality Assessments Using In-vivo Experimental Model on Bambara Groundnut
(Vigna subterranea (L.) verdc.) Formulated Diets. Eur. J. Prev. Med. 2026, 14(1), 1-7. doi: 10.11648/j.ejpm.20261401.11
Copy
|
Download
AMA Style
Olayinka AJ, Ajayi DA, Odeniran OM. Protein Quality Assessments Using In-vivo Experimental Model on Bambara Groundnut
(Vigna subterranea (L.) verdc.) Formulated Diets. Eur J Prev Med. 2026;14(1):1-7. doi: 10.11648/j.ejpm.20261401.11
Copy
|
Download
-
@article{10.11648/j.ejpm.20261401.11,
  author = {Atoyebi John Olayinka and David Aderemi Ajayi and Oluwasanmi Moses Odeniran},
  title = {Protein Quality Assessments Using In-vivo Experimental Model on Bambara Groundnut
(Vigna subterranea (L.) verdc.) Formulated Diets},
  journal = {European Journal of Preventive Medicine},
  volume = {14},
  number = {1},
  pages = {1-7},
  doi = {10.11648/j.ejpm.20261401.11},
  url = {https://doi.org/10.11648/j.ejpm.20261401.11},
  eprint = {https://article.sciencepublishinggroup.com/pdf/10.11648.j.ejpm.20261401.11},
  abstract = {Bambara groundnut (Vigna subterranea) is a type of leguminous plant that thrives well in poor soil conditions and drought-prone areas and regions, making it an important crop for most subsistence farming practices and thus its capability to enhance food security in Africa. Studies have indicated and highlighted its resilience and ability to grow and be very productive even in harsh climates with minimal inputs and resources, which positions it as an important and sustainable crop for addressing food insecurity. However, despite its environmental resilience and nutritional potentials, this pulse still remains underutilized on the global market. This is particularly surprising given its rich nutrient profile, which makes it a valuable food source for health conscious consumers. Bambara Groundnut (Vigna subterranea (L.) verdc.) formulated diets were used in this nutrition work, with thirty (30) weaning wistar rats, comprising (six groups), including the test groups, the positive and the negative controls, in an in-vivo feeding experiment for 21 days, to determine the changes in growth, protein and important biochemical parameters. The results obtained showed that the dietary Feed Efficiency Ratio (FER) changes for the test groups ranges from 0.083 ± 0.03 for group 5 to 0.104 ± 0.03 for group 4; while the Net Protein Utilisation (NPU) ranges from 65.46 ±3.55 for group 5 to 81.70 ±2.78 for group 4. The Haematological parameters showed a hematocrit (PCV) for the test groups ranging from 34.95 ± 1.59% for group 6 to 42.63 ± 1.54% for group 5; while the RBC ranges from 6.65 ± 0.49 x 10⁹ / L for group 6 to 8.36 ± 0. 34 x 109 / L for group 4. Liver Enzyme activity were highest (AST) for group 3 with 171.30 ± 1.40 U/L, (ALP) for group 4 with 26.66 ± 0.41 U/L and (ALT) for group 5 with 128.33 ± 3.15 U/L. The work reveals the potentials of Bambara groundnut to sustain growth and developments, enhances cognitive developments, especially in children and adolescents.},
 year = {2026}
}
Copy
|
Download
-
TY  - JOUR
T1  - Protein Quality Assessments Using In-vivo Experimental Model on Bambara Groundnut
(Vigna subterranea (L.) verdc.) Formulated Diets
AU  - Atoyebi John Olayinka
AU  - David Aderemi Ajayi
AU  - Oluwasanmi Moses Odeniran
Y1  - 2026/01/26
PY  - 2026
N1  - https://doi.org/10.11648/j.ejpm.20261401.11
DO  - 10.11648/j.ejpm.20261401.11
T2  - European Journal of Preventive Medicine
JF  - European Journal of Preventive Medicine
JO  - European Journal of Preventive Medicine
SP  - 1
EP  - 7
PB  - Science Publishing Group
SN  - 2330-8230
UR  - https://doi.org/10.11648/j.ejpm.20261401.11
AB  - Bambara groundnut (Vigna subterranea) is a type of leguminous plant that thrives well in poor soil conditions and drought-prone areas and regions, making it an important crop for most subsistence farming practices and thus its capability to enhance food security in Africa. Studies have indicated and highlighted its resilience and ability to grow and be very productive even in harsh climates with minimal inputs and resources, which positions it as an important and sustainable crop for addressing food insecurity. However, despite its environmental resilience and nutritional potentials, this pulse still remains underutilized on the global market. This is particularly surprising given its rich nutrient profile, which makes it a valuable food source for health conscious consumers. Bambara Groundnut (Vigna subterranea (L.) verdc.) formulated diets were used in this nutrition work, with thirty (30) weaning wistar rats, comprising (six groups), including the test groups, the positive and the negative controls, in an in-vivo feeding experiment for 21 days, to determine the changes in growth, protein and important biochemical parameters. The results obtained showed that the dietary Feed Efficiency Ratio (FER) changes for the test groups ranges from 0.083 ± 0.03 for group 5 to 0.104 ± 0.03 for group 4; while the Net Protein Utilisation (NPU) ranges from 65.46 ±3.55 for group 5 to 81.70 ±2.78 for group 4. The Haematological parameters showed a hematocrit (PCV) for the test groups ranging from 34.95 ± 1.59% for group 6 to 42.63 ± 1.54% for group 5; while the RBC ranges from 6.65 ± 0.49 x 10⁹ / L for group 6 to 8.36 ± 0. 34 x 109 / L for group 4. Liver Enzyme activity were highest (AST) for group 3 with 171.30 ± 1.40 U/L, (ALP) for group 4 with 26.66 ± 0.41 U/L and (ALT) for group 5 with 128.33 ± 3.15 U/L. The work reveals the potentials of Bambara groundnut to sustain growth and developments, enhances cognitive developments, especially in children and adolescents.
VL  - 14
IS  - 1
ER  -
Copy
|
Download